They also throw t-shirts to the crowd.

I am sure after a game there presidents' approval ratings couldn't be higher!


 The exact result for how many games will occur in a World Series if each team wins 50% of the time is 4 games 1/8 of the time, 5 games 1/4 of the time and 6 and 7 games 5/16 of the time for both. This is a good check on our simulation.
 To answer the first question, 10,000 trials shows that if the games are a toss up the winner of the first game goes on to win the World Series 65.6% of the time. A glance back at almost 100 years of World Series, (eliminating ones that were not best of seven, and using wikipedia to see which team won first), shows that historically the first team to win wins the series 66% of the time. Perhaps that stat from Fox isn't so surprising.
 Finally the simulation reveals the number of games played, the series winner and the winner of the first game. The plot below shows that histogram.

 Here is Jim Leyland and a coach looking at Everett's hand after he was hit by a pitch.
 Leyland is my favorite coach, as much from when he coached the Pirates as for now coaching Detroit.
 Ordonez and his crazy hair at bat.
 It turns out that while curve ball in baseball really does curve a bit due to aerodynamic forces and they way it is thrown, that there is an optical illusion component. Many players claim that a curve ball seems to suddenly break, more than the physical science would seem to indicate. Turns out that is due to the eye shifting between central vision and peripheral vision as the pitch reaches the batter. Researchers from
 I would love to see this insight combined with high speed photography of curve balls to see if the comparison holds in real life as with the simulation (already done in the thesis above and elsewhere). Perhaps instead of just a regular baseball one could also use a ball painted half black and half white. Does that enhance the effect? What other variables could you change? I want a machine that throws baseballs with control to change the pitches every which way, a high speed camera and computer to capture the data (It exists). I can always design the experiments, and great minds think alike since much of this has been done, I just don't have the resources or time to follow through.

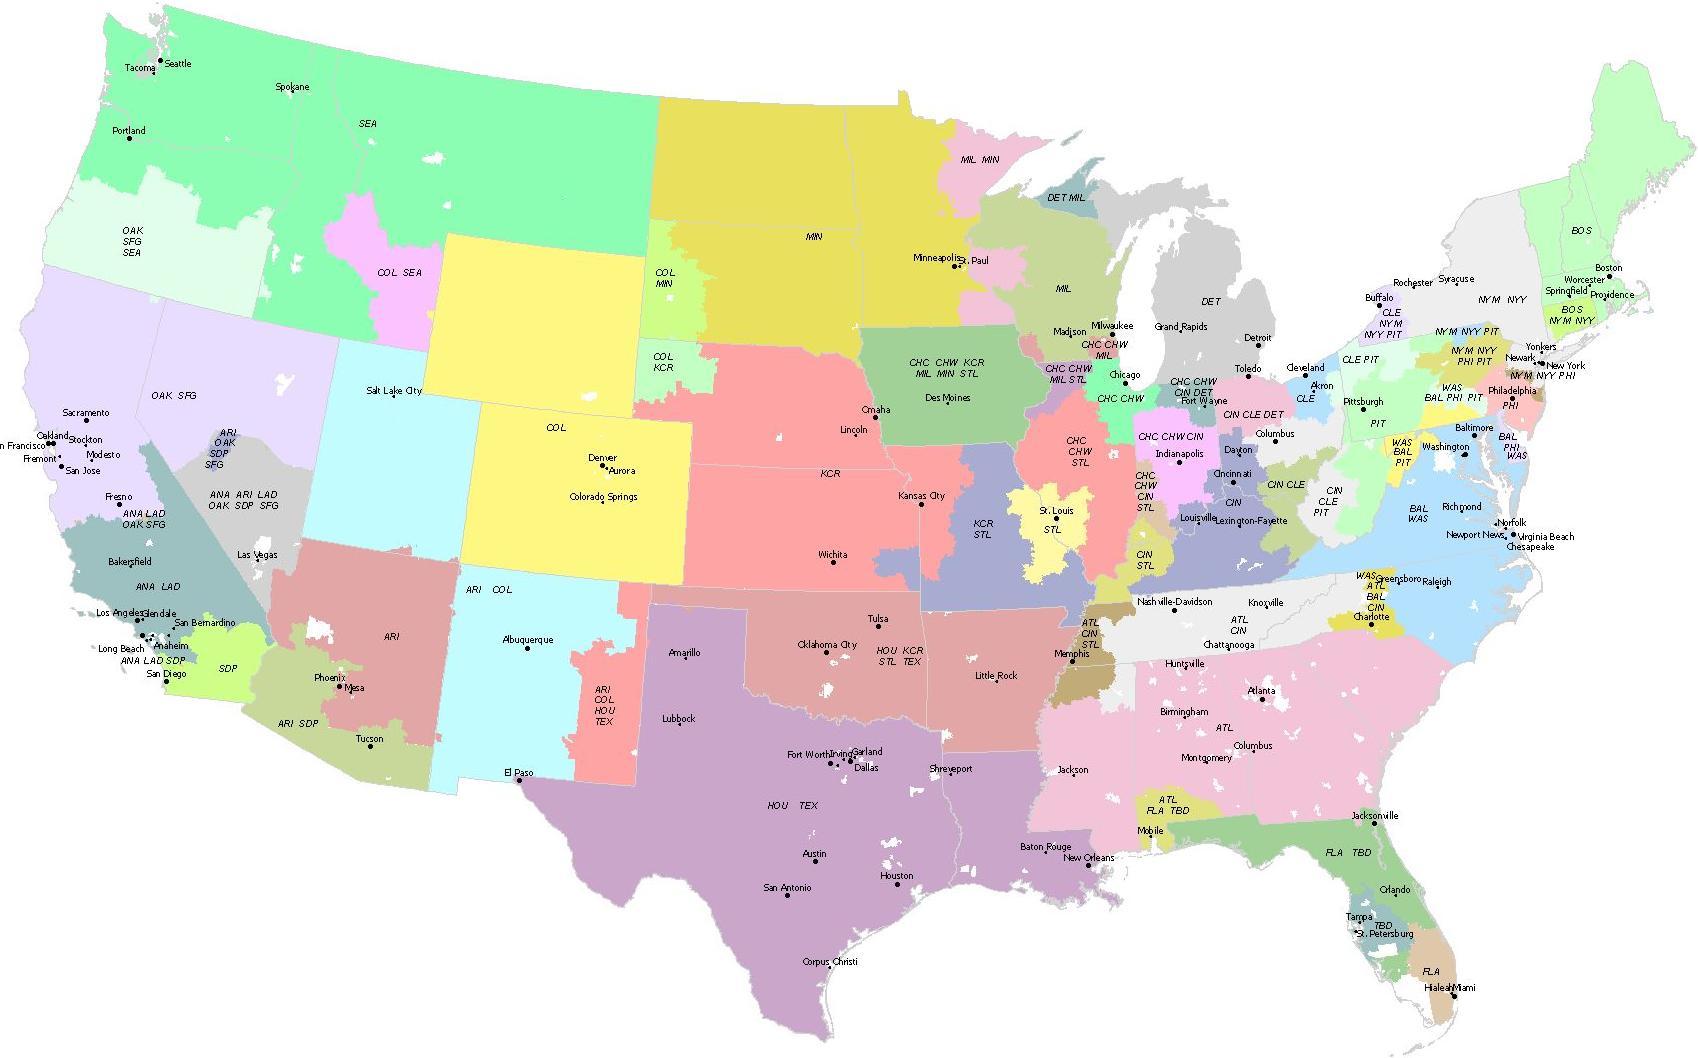
 However, my goal is to find a map generated using official data from MLB and even to find the data myself.
 I like the version above (click picture above for bigger) from a Yahoo article (map is presented without a credit), that includes the cities and team names so it is clearer when you look at a region. If multiple teams coexist in a region, all of those teams are blacked out on MLB.com or on MLB extra innings, with the expectation that you should watch the game on a local channel. This get really bad in baseball free Iowa, or if your cable company doesn't carry the correct local channel.
"The Yankees have one of the largest fan bases of almost any team in sports, even outside the New York area," says Verizon representative Deidre Mulcahy. "YES programming is a great way for Yankee fans -- and baseball fans in general -- to get more behind-the-scenes and in-depth programming on the Yankees."But then the other shoe drops:
The YES Network, which stands for Yankee Entertainment and Sports, will be the first regional sports network available in all of the Verizon's FiOS markets, and will be offered at no additional charge. Outside of the network's New York and New Jersey base, however, the programming will not include Yankees and Nets games.
Instead, those customers will see substitute YES programming, such as "Batting Practice Today" (featuring news, analysis, match-ups and BP coverage of the Yankees and opponents), "Yankeeography" (a Yankees biographical series) and the "Joe Girardi Show."
(bold mine)
 Each game is clear with, for example, W2 refering to the team that won game 2 or L4 referring to the team that lost game 4. Two teams from each Pool advance to Round Two, a winner and a runner up.
 Two teams advance from each Pool 1 and 2, a winner and a runner up. As displayed in the diagram below, in the semifinal the winner of Pool 1 plays the runner up of Pool 2 and vice versa. The winners of these games go on the the Finals.
 The plot (click it for larger) shows that the effect is weak, an increase of 10% over the median team salary yields only a 1.7% increase in games won over the median (about 1.4 games) and the correlation only explains about 15% of the difference in winning. 85% of the difference are due to other factors. This is true with and without the traditional Yankees team salary outliers from 2003 through 2007.
 So if salaries don't have a real effect on baseball wins and wins is what managers and owners aim for, why do they keep paying the big salaries? Paul says read Moneyball, and some teams are using SABRmetrics and other statistics to find the biggest bang for their player buck, why isn't it reflected in the salaries vs. wins? Nearer and dearer to my heart, why did the Detroit Tigers choose to pay a $137 million, team payroll (#3 below) and they are in last place in the central division, behind Kansas City for goodness sake?
| rank | team | salary |
| 1 | New York Yankees | $209,081,577 |
| 2 | New York Mets | $137,793,376 |
| 3 | Detroit Tigers | $137,685,196 |
| 4 | Boston Red Sox | $133,390,035 |
| 5 | Chicago White Sox | $121,189,332 |
| 6 | Los Angeles Angels | $119,216,333 |
| 7 | Los Angeles Dodgers | $118,588,536 |
| 8 | Chicago Cubs | $118,345,833 |
| 9 | Seattle Mariners | $117,666,482 |
| 10 | Atlanta Braves | $102,365,683 |
| 11 | St. Louis Cardinals | $99,624,449 |
| 12 | Philadelphia Phillies | $98,269,880 |
| 13 | Toronto Blue Jays | $97,793,900 |
| 14 | Houston Astros | $88,930,414 |
| 15 | Milwaukee Brewers | $80,937,499 |
| 16 | Cleveland Indians | $78,970,066 |
| 17 | San Francisco Giants | $76,594,500 |
| 18 | Cincinnati Reds | $74,117,695 |
| 19 | San Diego Padres | $73,677,616 |
| 20 | Colorado Rockies | $68,655,500 |
| 21 | Texas Rangers | $67,712,326 |
| 22 | Baltimore Orioles | $67,196,246 |
| 23 | Arizona Diamondbacks | $66,202,712 |
| 24 | Kansas City Royals | $58,245,500 |
| 25 | Minnesota Twins | $56,932,766 |
| 26 | Washington Nationals | $54,961,000 |
| 27 | Pittsburgh Pirates | $48,689,783 |
| 28 | Oakland Athletics | $47,967,126 |
| 29 | Tampa Bay Rays | $43,820,597 |
| 30 | Florida Marlins | $21,811,500 |


 Here is the governor, the mayor's chief of staff, the congressman and the senator waiting for the game to start.
 I thought Mike Castle was to throw out the first pitch but Tom Carper threw one, and that stupid Rocky Bluewinkle (MySpace) jumped in front when I took the picture.
 Then Carper waited around while Castle threw his "first" pitch. Mike castle was in a suit because he said he was also supposed to be at an event at the riverfront center near the stadium. I thought he was a good sport for doing both things.
 However, there was some excitement during the popcorn, hot dog and peanut race.
 Whenever I daringly post from a baseball game in progress (such as in Philadelphia, Baltimore and Washington this year, or Chicago's Wrigley Field) I always jokingly put that I am worried about copyright or describing the game, because I don't have the "express written consent of Major League Baseball". My reporting must be bad or I am a small fry because I never had any trouble.
 There was no love for Barry Bonds in the park yesterday as he was heckled every time he walked out to us in the outfield and every time he went to bet. No home runs from Bonds either he went 0 for 4 and apparently had no home runs in Philadelphia. 10 more home runs for his record but not here.
 Apparently this liberty bell lights up when the Phillies hit a home run. I did not get to see that yesterday either.
 I picked this picture because apparently I either run funny or was about to fall down (I am the stumbling man on the left). It is an action shot. The truth, justice and the American way picture is harder to compose, since those qualities are so abstract.