The chart (click for larger view) shows the discharge rate vs. the day and time at three stations, a small stream in Wilmington called Shellpot creek and the larger Brandywine Creek at Wilmington and one station farther north and upstream at Chadds Ford. Rainfall events (vertical lines at April 22nd, 24th, May 11th and 14th) show as upward spikes in the discharge rate which then decay over time if no additional rainfall occurs.
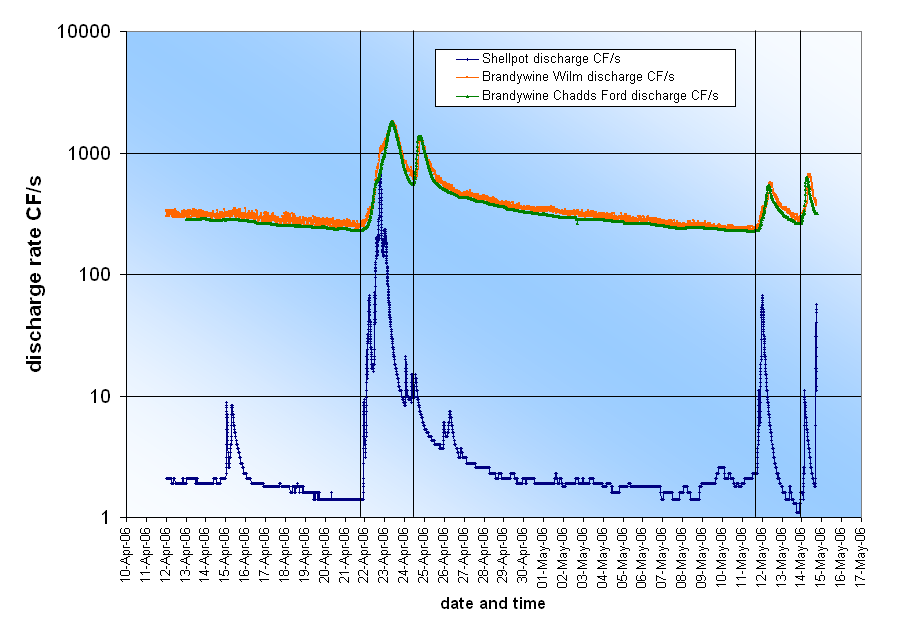 The Brandywine Creek empties a much larger watershed area than the Shellpot Creek so it not only has larger volume discharge rate but its curve is much smoother than the Shellpot Creek line. The jagged spikes overlaid on the smoother curve in the Shellpot Creek chart have their origin in local rainfall effects. Careful examination of the two Brandywine Creek curves shows that the Wilmington Station discharge rate lags the upstream Chadds Ford Station as would be expected by their locations. The USGS data provides a great resource for performing these weather analyses.
tags: Delaware, Wilmington, weather, water, USGS
No comments:
Post a Comment