Showing posts with label elections. Show all posts

Friday, November 07, 2008

Obama wins and Presidential Electoral Simulation predicts it

The current count for President-elect Obama has turned to 364 electoral votes now that North Carolina has finally clicked into the Democratic column. I was waiting for that to happen before I could crow about how my prediction of 364, based on the InTrade prediction markets, was correct. Honestly, I just used their data and made some pretty pictures and simulations to assuage my curiosity over just what the chances of a Democratic victory were.

I see that the great fivethirtyeight.com missed by those 15 electoral votes. In all seriousness, they seemed to have called much of everything else correctly, especially the popular vote.

Now to the transition team. President-Elect Obama picking Rahm Emanuel to be his Chief of Staff caused one of the submitters at Fark to quip:
"Obama officially offers the Chief of Staff spot to Rahm Emanuel. So they've got Matt Santos and Josh Lyman, now they just need CJ and Toby"
For West Wing fans who know that Josh Lyman's character was based on Rahm Emanuel and noticed the parallels of this election to the final election in the West Wing series, this is quite humorous.

Tuesday, November 04, 2008

Final Presidental Electoral Vote Simulation Predicts Obama win

It is no surprise that the final presidential electoral vote simulation based on the Intrade Prediction market data predicts a win for the Democrats and the Obama/Biden campaign. It has been trending that way for several weeks. Only 4 simulations out of 1000 show a McCain/Palin victory.

The median electoral vote from the simulations is 351, but the most frequent number is 364 electoral votes for Obama/Biden, which is my official prediction for the race. The table below shows that all of the states, according to the prediction market, have moved to strong Republican or Democratic except for Missouri, which is weakly Democratic at this point.


A plot of the electoral votes from the Intrade data over the past weeks shows that the Democrats have never been below 270 with a straight addition of the states. Though some weakly Democratic states would have left them with a deficit.

The plot of the median electoral votes and the fraction of simulations which resulted in a Democratic victory over the past few weeks shows that the lowest point in recent history was the week of September 16th.

Barring unforeseen circumstances, I think that the Democrats should emerge victorious. You can make that happen by remembering to vote.

Other sites show similar results using polling data:

FiveThirtyEight.com which has Obama at 348.6 electoral votes to McCain's 189.4 and the Democrats winning in 98.9% of his 10,000 simulations.

Electoral-vote.com has 286 electoral votes for Obama, and 225 for McCain with 27 in a tie. This site also uses state by state polling data.

RealClearPolitics.com has Obama with 278 electoral votes and McCain with 132 with 128 in the toss-up category. They use polling data. That is by far the most pessimistic result for the Democrats of these major polling and simulation websites. With no toss ups they have Obama with 338 and McCain with 200.

270towin.com is running very slow today. They use the last 1000 simulations in their visualizer to build up results that have Obama with 342 electoral votes and McCain with 196. They have the Democrats winning in 98.7% of their simulations. They also use probabilities of each state winning based on polling data with some clipping of the data. Even their 90% confidence interval has an Obama/Biden win with their most pessimistic number at 284.

The Truthisall 2008 electoral model has a final prediction with Obama winning by 76-64m votes; 367-171 EV; 53-45% vote share margin. They seem to be real concerned about election fraud and have a hard to understand election model with assignments for undecided voters.

What's your prediction?

Take the West Wing Quiz on Election Day

quiz_head_westwing.jpg

In honor of election day Mental Floss has the West Wing quiz. Do you remember that show? Seems like the current race is like the race in the last season of West Wing. How well can you do on the quiz?

I got 70% (7 out of 10). Guess I need to borrow my friends DVD's and review my answers.

Tuesday, October 28, 2008

One week to the election - Democratic electoral win in simulations

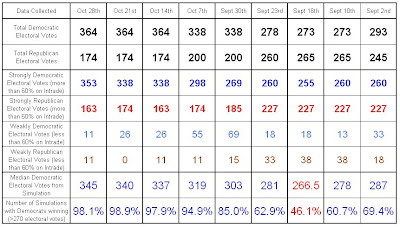
There is essentially not change from last week in the electoral vote simulations as predicted by the InTrade prediction market data for each state.


The median vote tally for Obama has crept up to 345, but the states in the strong and weak Democrat, and strong and weak republican columns have remain almost the same. With Indiana and Missouri wobbling back and forth but not changing party identities. MSNBC and others still try to make this look like a race, but the prediction markets say otherwise.


I will run the simulation again one more time next week before the election is over and then we can do some analysis.

Tuesday, October 21, 2008

Democrats maintain their formidable lead in Presidential Electroal. Vote Simulations

Barack Obama still holds a formidable lead in the presidential electoral vote simulations based on the state by state InTrade prediction market data. From today's results, the Democrats win 99% of the simulations and the median electoral vote count is 340.


There has been little change in the assignment of states to strong and weak categories except that previously weakly Republican Indiana has strengthened for McCain. If instead of the median we look at assigning the states based on the state by state prediction market data, the totals are 364 for Obama to 174 for McCain.


I imagine that the race will still tighten in these last two weeks. It will be interesting to see if that is reflected in the prediction markets.


Tuesday, October 14, 2008

Simulations asymptotically approach certainty for Democratic Electoral Vote Win

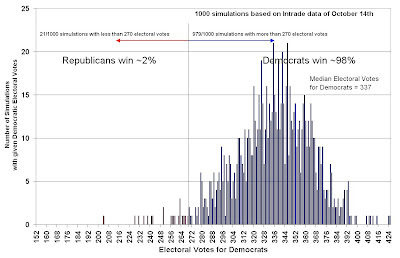
This week the electoral vote simulation pushes even closer to a certain Democratic electoral vote victory. Of 1000 simulations only 21 have the Democrats with less than 270 electoral votes based on the probabilities from the Intrade prediction markets. The chart below shows the distribution of 1000 simulations. 98% of the simulations yield a Democractic victory, and the median electoral vote count for Obama is 337.


I would guess that the Intrade prediction markets have digested all of the Obama vs. McCain polling data, the financial crisis and any other information about polling in the various states to slide even further over to the Democratic side in each state. This has the interesting effect of putting states that a few weeks ago were strongly Republican over into the strongly Democratic side. According to the Intrade prediction data the Democrats are weakly holding Missouri and North Carolina, never mind previously weak states like Nevada, New Hampshire, Ohio and Virgina that are strongly Democratic now, and the Republicans are weakly holding Indiana, as former battleground states become too solid to shake.


This data will be slightly different than the polling data since it is a prediction market site, but I still laugh when CNN or MSNBC tries to pretend we are still in a horse race when it looks like a solid Democratic victory is predicted at this point. I doubt the debate tomorrow will move anything one way or another. Three weeks to election day.

Monday, October 13, 2008

If the East Coast Is American enough For Al-Qaeda, It should be American enough for ...

Jezebel excerpted the exact quote I wanted from Sarah Vowell's interview on the Jon Stewart show on Tuesday October 7th. Sarah complained that Palin and the Republicans pay lip service to New York's bravery in 9/11 and then call New Yorkers "elite" and unpatriotic behind their backs. Sarah said, "They wrap themselves in our attack and then they leave and talk about what snobs we are."


My favorite comment from Vowell was this one: "If the East Coast Is American enough For Al-Qaeda, It should be American enough for them." Them being the aforementioned Republicans.

I like Sarah Vowell's books and their quirky take on history. I even forced us to visit the Rutherford B. Hayes Presidential Center in Fremont, Ohio because I was reading Assassination Vacation at the time. Her new book is The Wordy Shipmates.

Tuesday, October 07, 2008

Democrats running away in electoral college simulations

As the Intrade prediction markets digest the effect of the economy on the popularity of Obama vs. McCain in each of the states, there continues to be a movement towards Obama in many of the states and thus overall in the electoral college simulations.

The results of 1000 simulations using the Intrade prediction data as the probability that a given states electoral votes will be for the Democratic candidate or the Republican candidate show Obama winning 95% of the simulations. The median electoral vote count is 319 for the Democrats. The table below shows just how far Obama has pulled ahead of McCain in these simulations over the last few weeks.

Formerly String Republican states have gone weak and then over to the Democratic side. All of the states mentioned in previous weeks as being in the middle have moved to the Democratic side and a new crop of formerly Republican states have become up for grabs.

The states that are weakly Democratic now are Florida and Virginia. While now North Carolina has moved to exactly even, and Missouri has moved into the weak Republican category. I suspect the race will even out a little bit more before the end, but this looks like a commanding and perhaps insurmountable lead according to the Intrade prediction data. It will be interesting to see if the debate tonight really changes anything.

Tuesday, September 30, 2008

Democrats pulling ahead in Electoral Vote simulations based on prediction markets

This week's Electoral Vote Simulation is starting to show a wide lead in the electoral votes for the Democrats. I chalk this up to the Intrade prediction market data for each state beginning to reflect recent polling results which favor Obama and that are lower for McCain. This data should have taken into account the recent financial crisis in the news, McCain's strange campaign and debate off-again on-again gambit, and the debate itself. I think that these results offer some proof, along with the polling data, that Obama "won" the debate and that the economic issues are favoring him.

The median electoral vote result from 1000 simulations is 303 votes for the Democrats, while 85% of the simulations show the Democrats with more than the 270 electoral votes needed to win. This is the highest margins since I started running these simulations at the beginning of September. These results are also reflected in the strong vs weak Democratic or Republican states as seen in the table below.


The states that are weakly Democratic are Nevada, New Hampshire, Ohio, Virginia with new addition Florida pulled from the Republican side, the one that is weakly Republican is North Carolina. This shows a strengthening of Obama in formerly weak Republican states, and a weakening of McCain in formerly strong Republican states. I am sure there will be some regression to the middle before election day, but this is bad news for the Republicans no matter how you spin it.

For comparison I have included links below to much more professional interpreters of election and polling results. Other sites with electoral vote simulations of the election are:

FiveThirtyEight.com which has Obama at 329.3 electoral votes to McCain's 208.7 and the Democrats winning in 83% of his 10,000 simulations. This site uses a simulation based on the polling data and uses models to weight polls differently and to use regional information when individual state polls are unavailable or outdated.

Electoral-vote.com has 286 electoral votes for Obama, and 225 for McCain with 27 in a tie. This site also uses state by state polling data.

RealClearPolitics.com has Obama with 249 electoral votes and McCain with 163 with 126 in the toss-up category. They also use polling data.

270towin.com uses the last 1000 simulations in their visualizer to build up a results that has Obama with 298 electoral votes and McCain with 240. They have the Democrats winning in 85.6% of their simulations. They also use probabilities of each state winning based on polling data with some clipping of the data.

The Truthisall 2008 electoral model has Obama winning almost all of their 5000 simulations. They seem to be real concerned about election fraud and have a hard to understand election model with assignments for undecided voters.

I have also mentioned getting my data from the Intrade Prediction markets, and Yahoo's Political Dashboard.

I invite you to form your own opinions about the various electoral vote models across the web. I run my model for fun and I sue the Intrade prediction market data because it is very easy to turn into a simulation. Some have issues with this data. I don't have the time or the energy to review the state by state polling data to create probabilities for simulation, and I think that FiveThirtyEight.com has done a very good job of doing that. I just think that the model doesn't seem to be transparent enough for me to duplicate it as you could do with mine so it is hard to check the results or evaluate the assumptions. 270towin.com seems to have a similar good approach, but still lacks transparency in the model, and have their own opinion about handling the data. The other models fall further away from these good examples.

My idea is to gather all of the voters on November 4th, count their results, assign electoral votes according to the rules in each state (winner take all, except for Maine and Nebraska) and see who wins. That results will have the least error (though there will be some).

Tuesday, September 23, 2008

Democrats back in the lead again in the Presidential Electoral Vote Simulation

This week's simulation of the electoral votes based on the InTrade Prediction market data once again shows a Democratic victory in 63% of the simulations, with a median Democratic electoral vote count of 281. Today, FiveThirtyEight.com has the Democrats even further ahead with 312 electoral votes and a Democratic victory 74% of the time, but he uses a less transparent simulation using polling numbers for his simulation.

This is an upswing from last week's prediction of a republican victory and probably represents the inTrade prediction markets digesting the bump in popularity that Senator Obama has gotten due to the recent crisis in the financial markets. The candidates seem to trade the same few states back and forth as before. This week Colorado and New Hampshire are weakly Democratic, and Ohio and Virgina are weakly Republican. Nevada is essentially tied in the Intrade data. Losing Nevada would still leave the Democrats with 273 electoral votes.

Intrade has jumped on the visualization bandwagon with a graphic on their front page showing the electoral college results based on their prediction data. They join Yahoo's election dashboard, who was already using the Intrade data, as well as poll data. Truthisall has his own simulation in which he thinks Senator Obama's chances are even better than my results or 538's results. He thinks that there has been systematic election fraud for decades so I invite you to interpret his results yourself. 270towin has their own simulation based on the polls. They predict the Democrats have a median 276 electoral votes and a Democratic win 60.2% of the time.

Tuesday, September 16, 2008

Presidential electoral vote simulation predicts Republican Victory

The Palin Republican Convention bounce seems to be having a continuing effect on the presidential electoral vote simulation based on the Intrade Prediction market data of September 16th. As described earlier, I use the Intrade data to generate a probability for each state of tghe Democrats winning that states electoral votes. I generate 1000 Monte Carlo simulations based on these probabilities.

This week the chart shows that the the Democrats win with more than 270 electoral votes only 46% of the time. This is the first time that the simulations predict the Republicans winning more than half of the time. I think that we could see this coming as the prediction markets and polls continue to digest Sarah Palin's popularity and McCain's bounce. FiveThirtyEight.com shows similar results based on their excellent simulations based on state polls, with only 44.6% of simulations with an Obama victory.

As a prisoner of Excel as my math, simulation and graphing program, I am jealous of Yahoo's new election tracker dashboard that uses either state polls or the Intrade prediction market data to show the electoral vote results. It made me notice something interesting about the Intrade prediction market data. If I just use that data, as Yahoo does, to predict whether a state will go Democratic or Republican, the results is that the Democrats win with 273 electoral votes. But the prediction markets have been shown to represent the collected estimated probability that the players expect for a particular outcome. So while Delaware options are at 95cents (on the chance of $1.00 if the option pays) for the Democrats which makes that a pretty sure bet, Colorado is 55cents Obama vs 47.6cents for McCain which makes that close to even odds. That's why I like my simulation approach better.

The table below (click it for larger and more readable) compiles the simple sum of the prediction market data and then breaks out strong states, those with 60% chance of one of the sides, vs weak states, those with less than a 60% chance for one of the sides. It is there where you can see the closeness of the race.


Remember that in the simulation even Delaware could go for the Republicans 5% of the time. Highly unlikely but possible, especially with the potential error of the data we are using. A state like Colorado could go either way. The progression over two weeks since Sept 2nd doesn't seem to put more electoral votes in play in the weak states (51 to 56), but it does seem to move some weakly Democratic ones to the weakly Republican column. This week the states that are weakly Democratic are Colorado, New Hampshire and New Mexico, while the weakly republican states are Nevada, Ohio and Virgina. On Sept 2nd the states that are weakly Democratic were Colorado, New Hampshire and Ohio, while the weakly Republican states are Nevada, and Virgina. As the pundits have said, Ohio and Virgina are going to be important, and even some Western states are going to have a role to play

Wednesday, September 10, 2008

This week's presidential electoral vote simulation

I made an error in last week's simulation using the Intrade Prediction Market data by using the bid value for the probabilities instead of the last value. The last value seems to be an average of the bid value and ask value and better represents the actual payout at the expiration of the option.

Here is last week's chart showing 1000 simulations using the correct value data from Sept 2nd

The difference is only 70% of simulations showing the democrats winning as apposed to 75% on the incorrect chart from Thursday. I suppose I developed the formula for the concept but erred in its application. The above chart uses a more correct value for the probability built from the last value rather than bid or ask.

Here is this week's chart using showing 1000 simulations the value data from Sept 10th.

The probability of a given state being won by the Democrats is still the Democratic win value divided by the Democratic win value plus the Republican win value. Each state is still winner take all, and the rand() function takes care of the simulation part. This week shows the results of the Palin bounce (I don;t think it should be called the Republican convention or McCain bounce), but still shows the Democrats with more than the 270 electoral votes needed to win in 60% of the simulations. The median result is 278 electoral votes for the Democrats. We can monitor the situation over the next few weeks to see if the intrade data shows the republican bounce going away or not. Even with the poles where they are the simulations from the Intrade data still seem to predict a Democratic victory.

Intrade also allows trading in how many electoral votes will go to the Democrats or Republicans and gives many trading options at different bands of electoral votes, such as Democrats win more than 270 electoral votes. If we assume that the value for these trades represents the community's aggregate probability estimate we can compare the data to each other for consistency (democrats plus republicans should equal 538) and to the simulation above. I will build these charts for later.

Thursday, September 04, 2008

Simulating the presidential election - state by state is best

There are a number of sites out there that attempt to predict the presidential election. I prefer the sites that add some simulation to the process so that we can see not just a prediction but the relative accuracy and sensitivity of the results to the input data.

The Presidential Vote Equation derived by Ray C. Fair uses the econometric approach which predicts just the Democratic and Republican popular vote share. Fair's simple regression showed that the important variables are incumbency for the person and party, typically a negative effect, and economic good times are good bad times are bad. This year if the economy stays bad the Democrats are favored, but it could be a dead heat if the economic bad news is not as bad as expected.

I think the best or most interesting predictors are the ones that examine the polls from many states to calculate state by state electoral votes because that is the way the president is chosen, not by popular vote. The best I have seen thus far is FiveThirtyEight.com (named for the 538 electoral votes). They work through the polls in every state and group like regions together to estimate polls for states when there is a long time between polls (Delaware, for instance, is in the "Acela" Mid-Atlantic group). They predict 307 electoral votes for the Democrats today (up from 303), comfortably more than the 270 needed to win. They also perform simulations based on the error in the polls to generate various scenarios. They have a democratic win in ~70% of the scenarios.

I took a crack at this approach using the Intrade prediction market data. Users of the site can purchase stock in a particular outcome, for instance, Delaware's electoral votes go to the Democrats. Users buy and sell their shares at values based on their confidence in the outcome. It has been shown that this is a predictor of the group's estimation of the probability of this occurrence. I took the probability of the democrats getting the electoral votes and divided by the sum of the either party getting the votes to generate a Democratic probability. Then I used the rand() function in Excel, if it beat the probability, votes went to the Democrats otherwise to the Republicans. Adding up all of the states yields the total electoral votes for the Democrats who need 270 to win.

(click picture or here for larger)

Thus my simulations show that, using the Intrade Sept 2nd data and assuming winner take all in each state (even Maine and Nebraska), the Democrats garner 270 electoral votes or more in 75% of the simulations. The most likely being 277, the median is 289. After the Republican convention is over we can see how this changes. Great care should be taken with these estimates since some of the states have only a few trades and thus the error in the estimated probability is high. I could try to factor that in to the simulation, but I feel the point is proven in principle and we can leave the heavy lifting to the folks that do it for a living, instead of for fun.

All the states from first to last

Did you notice that Democratic VP nominee, Senator Joe Biden, is from the first state, Delaware, and that Republican VP nominee, Governor Sarah Palin, is from second to last state, Alaska, the Last Frontier? Obama lived in Hawaii, the last state. This is the most inclusive election ever, from the first state to the last.

Sunday, June 24, 2007

Need help in picking your presidential candidate?

The presidential candidate selector quiz asks the questions and then matches you to your candidate. I have to admit, I had to look up my own number one result. Kent McManigal is a far out write in candidate for radical libertarians. Let me go check those answers again...

My results:

Your Results:

1. Theoretical Ideal Candidate (100%)
2. Kent McManigal (83%)
3. Ron Paul (76%)
4. Dennis Kucinich (72%)
5. Barack Obama (67%)
6. Alan Augustson (60%)
7. Bill Richardson (58%)
8. Christopher Dodd (58%)
9. Mike Gravel (56%)
10. Wesley Clark (56%)
11. Al Gore (55%)
12. Joseph Biden (54%)
13. Hillary Clinton (52%)
14. John Edwards (47%)
15. John McCain (47%)
16. Newt Gingrich (46%)
17. Chuck Hagel (45%)
18. Mitt Romney (40%)
19. Sam Brownback (37%)
20. Fred Thompson (36%)
21. Mike Huckabee (30%)
22. Rudolph Giuliani (30%)
23. Tommy Thompson (29%)
24. Tom Tancredo (28%)
25. Jim Gilmore (22%)
26. Elaine Brown (22%)
27. Duncan Hunter (21%)

You can find the quiz at the 2008 Presidential Candidate Selector.

(via Exploding Aardvark)