How to explain your research at a party.

One might have just as easily titled this "the six stages of increasing desperation when explaining your research at a party."
How to explain your research at a party.
 Here is the cleft:
 The width is about 3.25 inches:


 I pieced them all together in the following video.
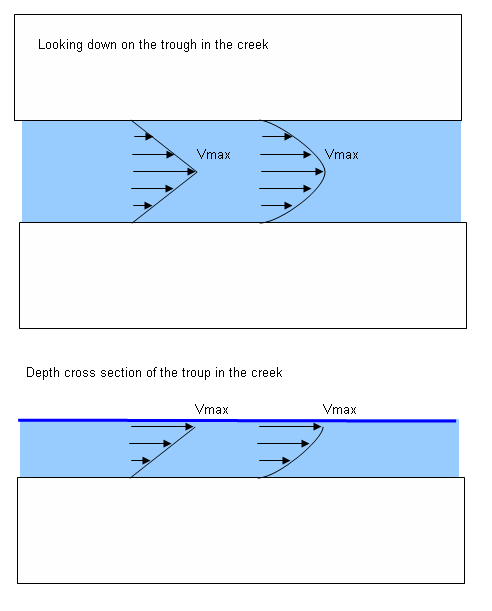 If we assume a linear velocity profile the average velocity is 5.59 inches/sec multiplied by a 2 inch depth and a 3.25 in width to get 36.3 cubic inches/sec for the flow. In reality the velocity profile is more parabolic like the right hand side of the diagram above and the average velocity is higher. Also, the channel is not smooth on the sides or the bottom, because of pebbles and stones and even the cross section will not be regular. Close examination of the video of the leaves floating by shows that they often go fast on the right hand side of the flow of the creek and slower on the left hand side, giving another clue that the velocity profile isn't simple.
  A study of baby, monkey and primate laughter shows evolution of laughter seems to follow the evolution of primates.
 A study of name popularity indicates a correlation between unpopular names and juvenile delinquency. Do I wish I knew that before we named our son?

 I also like the contrast between normal person and doctor or engineer, it doesn't appear that you can be both.
 Several articles in the press and out on the web today have sensationalist titles like "Where are the acorns?", "Acorns disappear across the country" and "Acorn Watchers Wonder What Happened to Crop". Even Topix has a a forum topic devoted to it. Then the various articles ring the climate alarm quite vigorously. Others use the false analogy of disappearing acorns to disappearing bees. Once again eye catching headlines win out over even reasonably thoughtful study.
 From the figure caption from the article: Fig. 1 Example time series of mast production. (a) Hastings Reservation (California) site, Q. agrifolia, (b) Hastings Reservation, Q. douglasii, (c) Missouri, Q. coccinea, (d) Missouri, Q. alba, (e) Massachusetts, Q. rubra. In (a–b) each line represents values for individual trees; in (c–e), lines represent yearly means for each plot. Heavy lines represent yearly grand means.
 It is interesting that people at least notice their environment somewhat, but noticing only the negative events and lacking the scientific curiosity to determine if the phenomena is fleeting or cyclic or permanent almost defeats the benefit of being observant in the first place.
 The winner, Brian Stewart, wore a loin cloth and enacted in dance the hunting of an antelope (played by a colleague, archaeologist Giulia Saltini-Semerari) and then topped it off with the touching gift of the hide to a tribe member to present "Refitting repasts: a spatial exploration of food processing, cooking, sharing and disposal at the Dunefield midden campsite, South Africa".
 "The eventful life of galaxies in low density environments" by Ruth Gruetzbauch was charmingly portrayed as a tango ending with the two dancers (as galaxies) locked in an embrace.
 How would you perform a thesis entitled "Analysis of thymic nurse cells in the chicken"? Professor Josef Penninger did the chicken dance, what else!
 Nicole-Caudia Meisner won the postdoc catagory by tap dancing her way through "mRNA Stability Regulation as a Drug Target: mRNA Stability Cross-Screening and Molecular Mechanisms in Post-Transcriptional Regulation resolved bu Quantitative Biology."

 As more and more public venues put in radiation detectors in the aftermath of 9-11 and the general terrorist scare, it appears they are catching more patients with residual radiation left over from medical tests than terrorists.
"You must pass through radiation detectors to enter and leave the room where the experiments are performed to make sure that no radioactive material leaves the room for safety reasons. The detectors start by stepping in them or when they detect any radiation, this last property was the source of the fun.That recollection was inspired by a story about a woman driving who set off detectors intended to catch mobile radioactive terrorists.
During one of our trips to NIST, where the experiments were performed, one of the group had just undergone a medical test similar to the one of the woman above that involved injecting a radioactive tracer. The sensitivity of the radiation detectors at NIST was so high that this newly radioactive group member could set them off from 40 feet away. His residual radioactivity was so high that he could make you fail the test (proclaimed with loud alarms and flashing lights) while you were in the machine and he was far away. It was great (if a bit geeky) fun."